
GameStop June 3 - June 14 Unprofitable Returns Outnumbered Profitable Returns
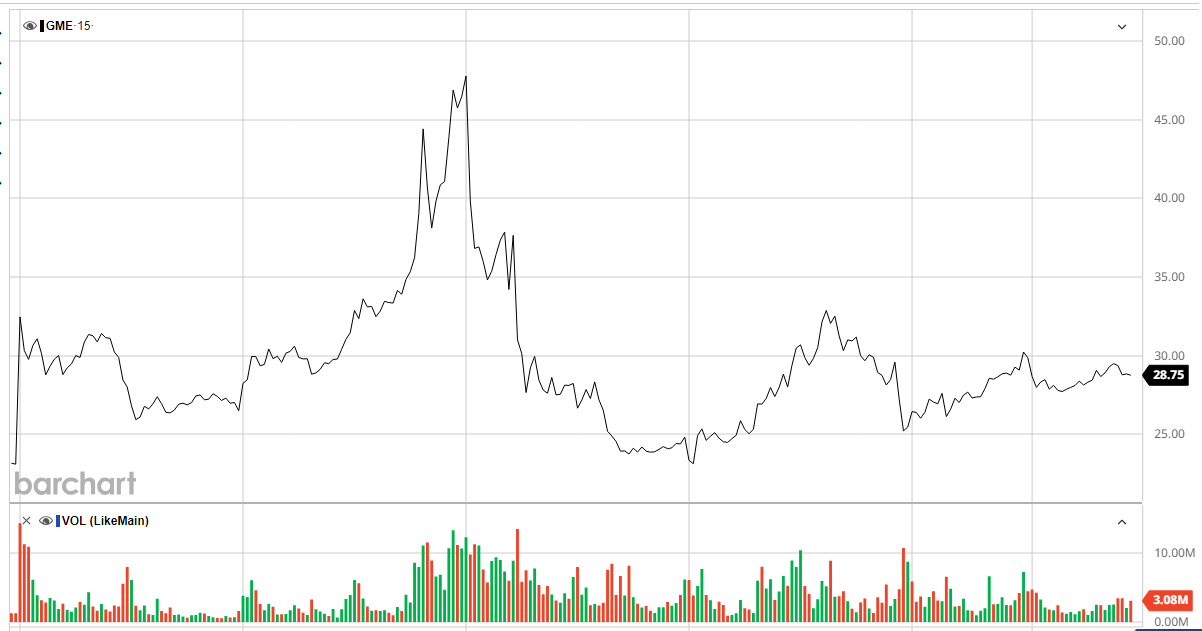
GameStop (GME) prices were on a roller coaster ride from June 3, 2024 through June 14, 2024. These volatile price upside and downside patterns resulted in more buy and sell returns being unprofitable than profitable for the two-week period.
3D Chart of All Buy any Sell Returns
The following 3D chart of buy and sell percent returns for June 3 through June 14 is based on 260 15-minute price intervals for 10 regular market sessions.
For that ten-day period there were 33,670 buy and sell percent returns. 15,060 (44.73%) buy and sell returns made money (green areas) and 18,610 (55.27%) lost money (red areas). The ratio of unprofitable returns to profitable returns was 1.236.
The largest gain was 84.23% and the largest loss was 51.58%. The average return was a 1.62% loss.
Important Lesson
Volatile prices lead to volatile returns.
See GameStop June 3 Trade was Unprofitable for Most Traders.
See GameStop June 3 - June 7 Returns Were Volatile.
See GameStop June 3 - June 21 Unprofitable Returns Outnumber Profitable Returns 2 to 1.