3D Percent Returns Chart: Lumber 2021 Bubble Price Pattern
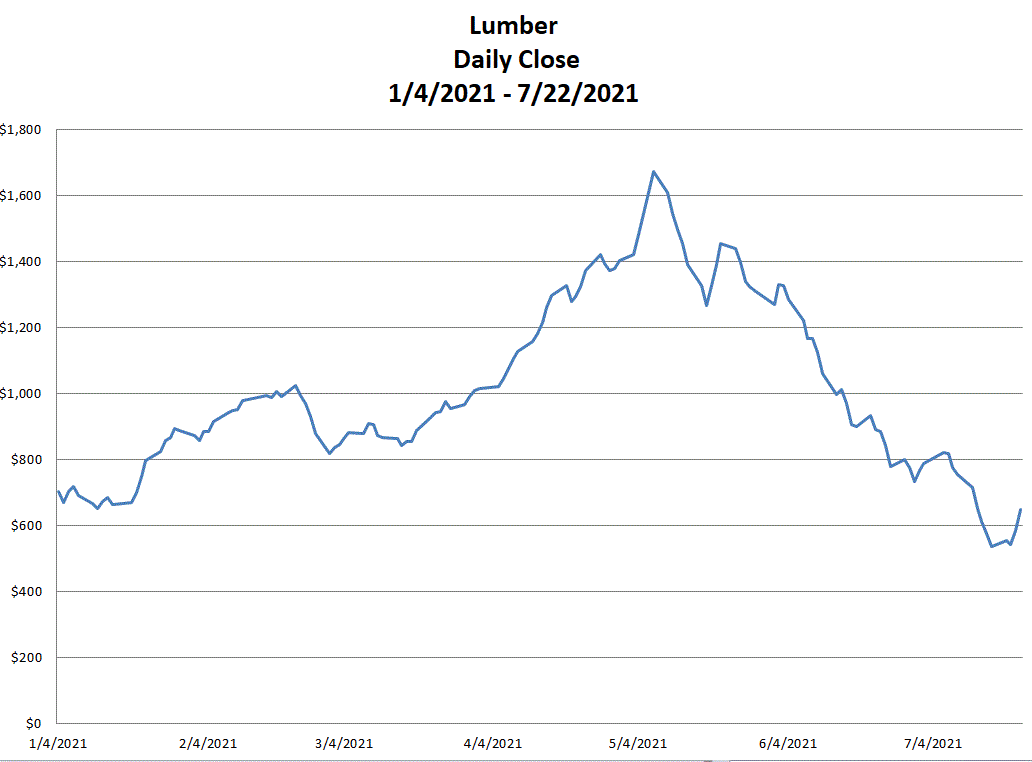
Lumber futures more than doubled in 2021 to peak and then collapse to the downside. All daily close price data are from Macrotrends.

3D Percent Returns Chart
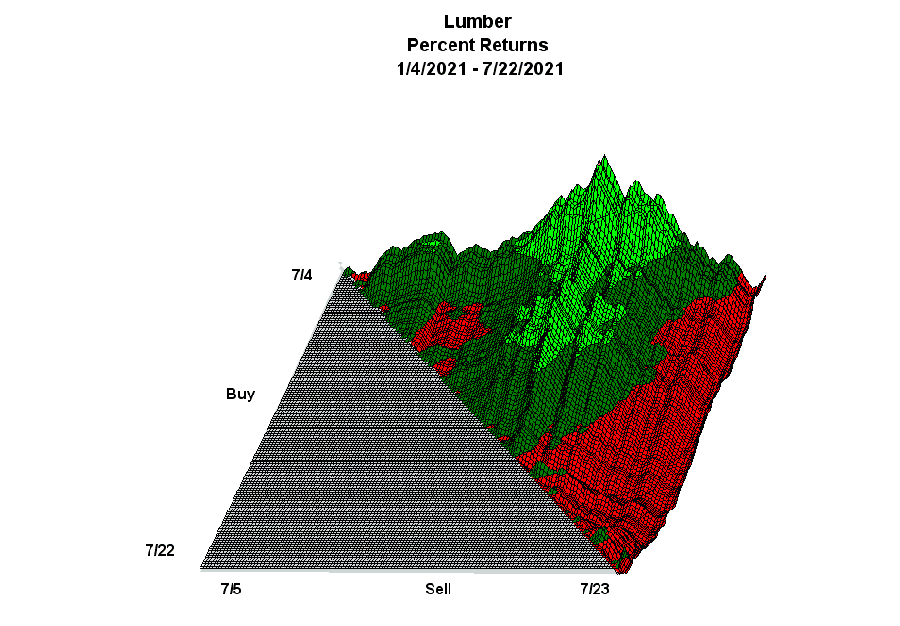
The 3D percent returns chart shows the gains and losses for the weekly buy and sell returns from January 4, 2021 through July 22, 2021.
The green areas represent the profitable returns and the red areas represent the unprofitable returns. Of the 9,591 buy and sell returns 5,625 (58.65%) made money and 3,966 (41.35%) did not. The maximum return for the period was 157.04%.
Related Articles and Calculator
Stock 3d Percent Returns Chart Articles
3D Surface Chart of Returns: Upside Price Pattern for Amazon
Analyzing Price Upsides and Downsides
Cyclical Price Return Calculator
Price Bubbles Always End Badly

