
20-Day, 50-Day and 200-Day Moving Averages Smooth a Price Series
A simple moving average (SMA) smooths the fluctuations on a price chart so you can easily see upside and downside trends. Here are the 20-day, 50-day and 200-day moving averages for Apple (AAPL).
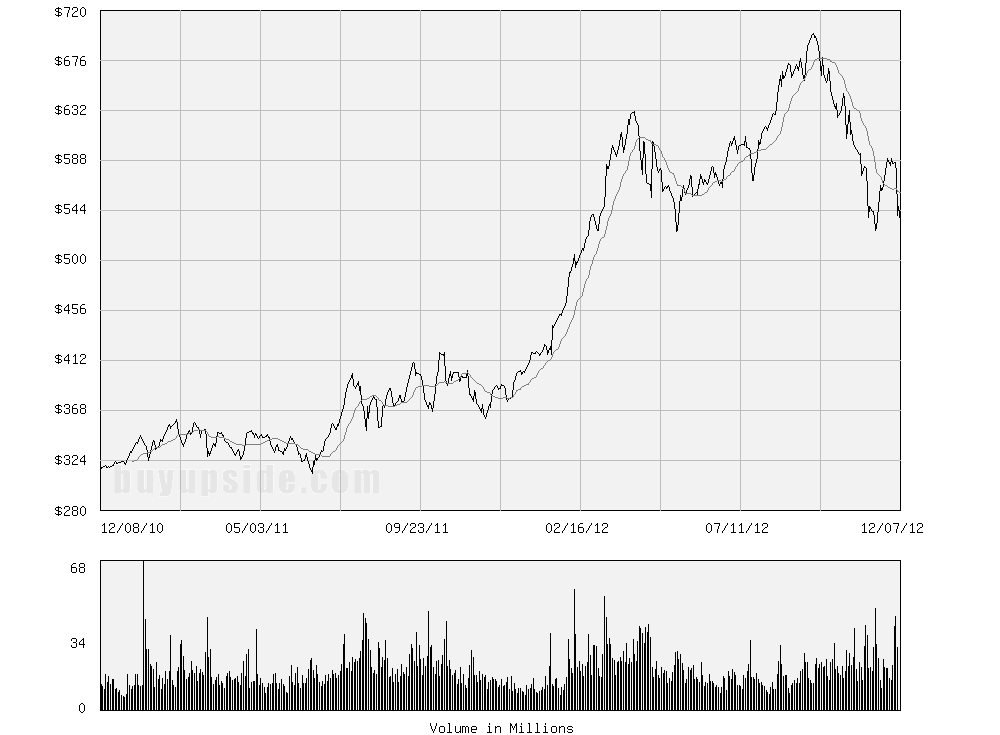
20-Day Moving Average
The 20-day moving average (gray) closely tracks the underlying daily closing prices. Notice that the moving average peaks and bottoms lag the peaks and bottoms of prices.
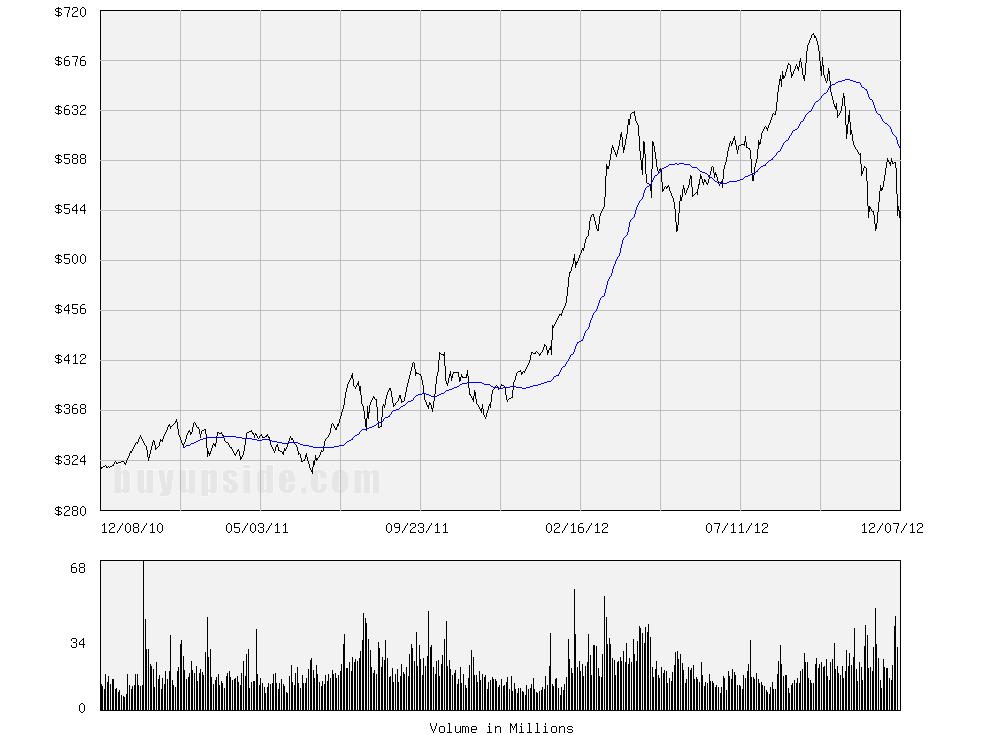
50-Day Moving Average
The 50-day moving average (blue) lags the price series even more; the peaks and bottom of the 50-day moving average occur after the 20-day moving average peaks and bottoms. All moving averages peak and bottom after prices peak and bottom.
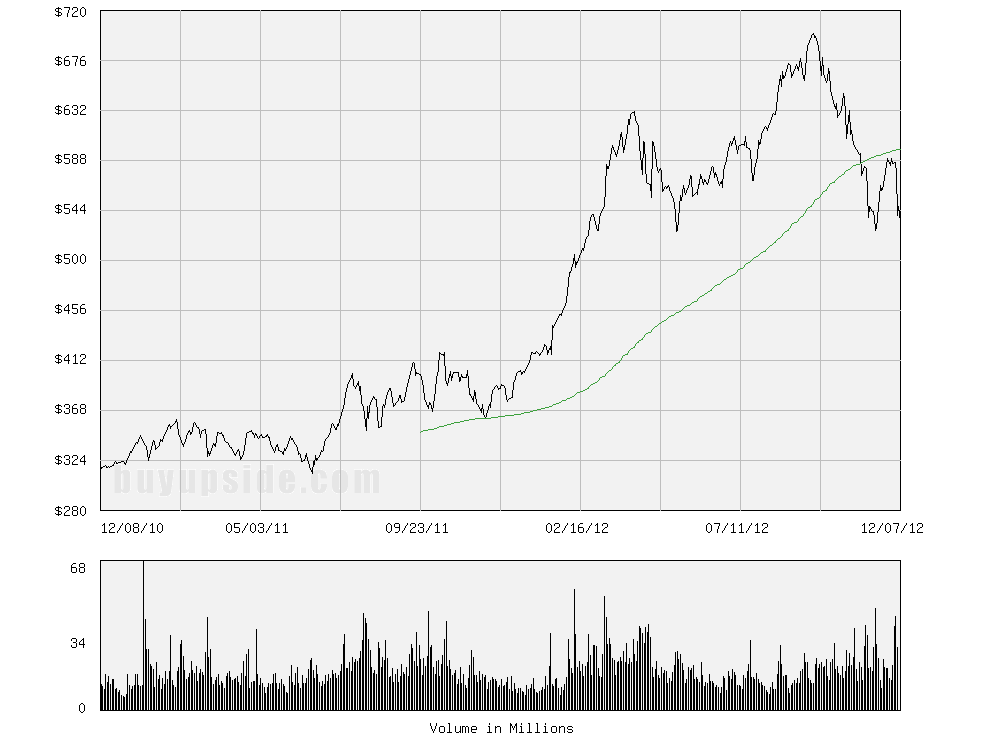
200-Day Moving Average
The 200-day moving average (green) lags the 50-day moving average; it has not peaked in the next chart.
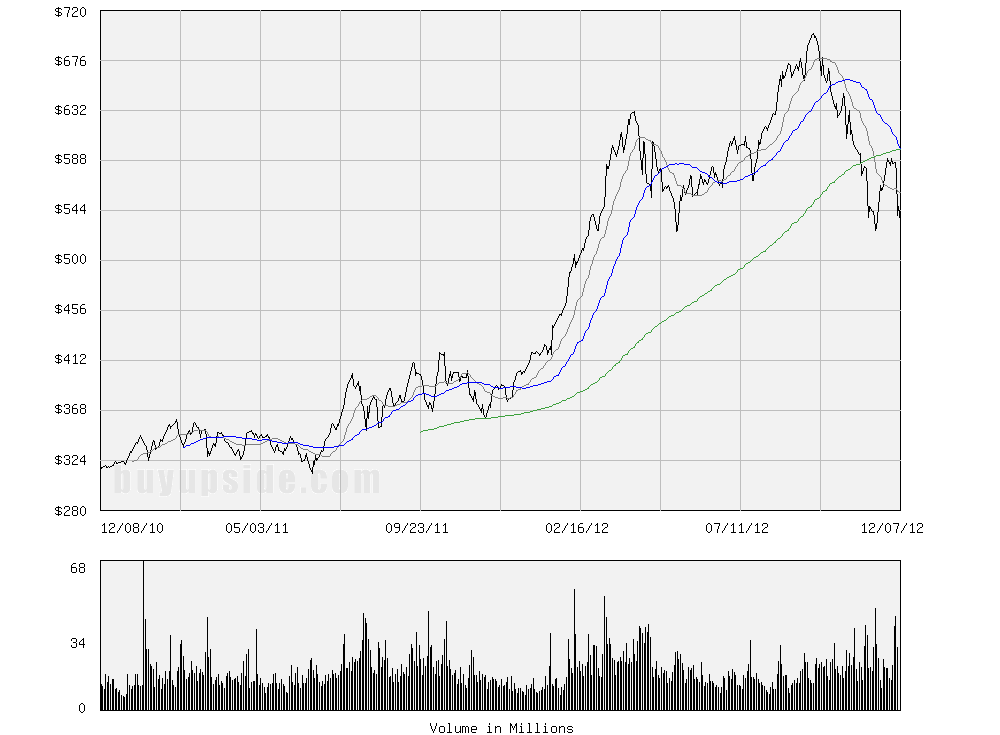
20-Day, 50-Day and 200-Day Moving Averages
The 200-day moving average lags the 50-day moving average and the 50-day moving average lags the 20-day moving average.
The 50-day moving average is above the 200-day moving average for most prices, but for the most recent prices it is approaching the 200-day moving average. If prices continue to fall, the 50-day moving average will cross below the 200-day moving average. For the most recent prices, the 20-day moving average is already below the 200-day moving average.
Related Articles and Chart Makers
Bollinger Bands Define Upper and Lower Price Boundaries
Dow Jones Industrial Average Stocks - Current 50 and 200-Day Moving Averages
Moving Average Chart Maker