
Analyzing Price Upsides and Downsides
Common sense and experience tells investors that a good time to buy a stock is when prices are rising on the upside. Buy low and sell high is your goal. Yet, many investors buy when prices are on the downside because they reason that a stock must be a "good buy" if it has gone from, for example, $50 to $30. Often this so-called bargain turns into a very bad buy as the stock price continues to fall.
This article describes the Complete Trading Model (CTM), a technical analysis tool that Richard Howard of buyupside.com developed, which computes the percent return of every buy and sell combination for a selected price series. With CTM you can determine the number of buy and sell combinations that make money and the number of combinations that do not. Therefore, the analysis produces easy-to-understand, verifiable quantitative data which show that buying on the upside is a winner's game and buying on the downside is a loser's game.
For example, from January 3, 1994 to December 12, 2000 Merck (MRK) experienced a long-term price upside that consisted of 1,558,495
buy and sell combinations based on daily closing prices of which 1,451,233
(93.12%) made money. But of the 454,581 buy on the downside and sell on
the downside trades after the peak through October
19, 2004, only 99,371 (21.86%) were profitable. So investors had
a 9 out of 10 chance to make money when they bought and sold on the upside
but only a 1 in 5 chance when they bought and sold on the downside.
How the Complete Trading Model (CTM) Works
Consider a price series consisting of two parts: the upside and the downside. The upside is the group or prices that start with the lowest price (bottom) of previous cycle and end with the maximum price (top) in the series. The downside starts with the next price after the maximum price and ends with the lowest price of the downside. This series of upside and downside prices is called a cycle. The following price chart shows a series of 10 hypothetical monthly closing prices. The upside has six prices and the downside has four prices.
The CTM Trade Table
CTM computes the percent return, (Sell price - Buy Price)/Buy Price, for
each buy and sell combination (trade) and then classifies each trade as
a winner (makes money) or a loser (breaks even of loses money).
CTM stores the percent return for each trade in the CTM Trade Table, which is organized by buy and sell dates for each of the following three CTM trade types:
A buy upside and sell upside trade
occurs when a purchase date occurs before the peak price and a sale date occurs on or before the peak price. So both the buy and sell occur on the upside of the price pattern. An upside buy can not occur on the date of the peak because CTM dos not allow a buy and sell on the same date. An upside price pattern with a few down prices has more winning trades than a pattern with many down prices The buy upside and sell upside trade type has the highest proportion of profitable trades of the three trade types.
A buy on the upside and sell on the downside trade
occurs when a purchase date occurs on or before the peak price and a sale date occurs after the peak price. A buy occurs on the upside as prices are rising and a sell occurs on the downside as prices are falling. The proportion of profitable buy upside and sell downside trades is usually less than the proportion of winning trades for the buy upside and sell upside trade type.
A buy on the downside and sell on the downside trade
occurs when a purchase date is after the peak price and a sale date is after the peak price. So both the buy and sell occur on the downside of the price pattern. A downside price pattern with few rising prices has more losing trade than a downside pattern with more rising prices. Of the three trade types, the buy downside and sell downside trades have the fewest profitable trades.
The following CTM Trade Table shows the 10 hypothetical monthly prices
and the
resulting 45 trades. Note: The number of trades = ((Number of prices)
x (Number of prices - 1))/2 = (10x9)/2 = 45. The gains and losses are expressed as percents.
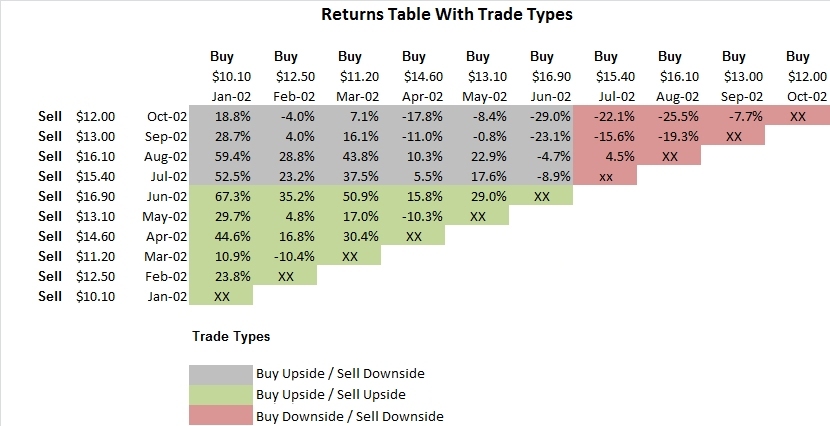
Locate the Sell Date and Sell Price columns on the left side of the CTM
Trade Table. The next column to the right includes the gains and losses
for the buy and sell combinations for the first buy price, which is $10.10
and occurs on Jan-02. The buy prices and dates are located in two rows
at the top of the table.
For the first buy price the first sell price is $12.50 on Feb-02. So
the gain for the first buy and sell combination is 23.8%. The second sell
price is $11.20 for a 10.9% gain. The third trade results in a 44.6% gain
for the $14.60 sell price. The last trade for the first buy price occurs
on Oct-02 at the $12 sell price. The gain is 18.8%. There are nine trades
for the first buy price.
The second buy price is $12.50 and occurs on Feb-02. The first trade for
this buy price occurs on Mar-02 at the $11.20 sell price for a 10.4% loss.
The second trade occurs on Apr-02 at the $14.60 sell price for a 16.8%
gain. The last trade for the $12.50 buy price occurs on Oct-02 at $12
for a 4.0% loss. There are eight trades for the second buy price.
The third buy price of $11.20 has seven trades, the fourth buy price of
$14.60 has six trades and so forth until the last buy price, which occurs
on Sep-02 at a buy price of $13. This trade has an Oct-02 $12 sell price
and a 20% loss.
There is no trade for the last buy price on Oct-02 because CTM does not
allow a buy and sell transaction on the same date.
CTM Trade Type Summary
There were 45 trades for the 10-price series. The winning trades out numbered the losing trades 29 (64.4%) to 16 (35.6%). The average gain for all 45 trades was 12.1%. The largest one-trade gain was 67.3%. The largest one-trade loss was -29%. Note: The total number of trades = ((number of prices)*(number of prices-1))/2.
Buy Upside and Sell Upside Trades
There were six upside prices and 15 buy upside and sell upside trades.
Thirteen trades (86.7%) were profitable and two (13.3%) lost money. The
range of returns was a high of 67.3% to a low of -10.4%. The average gain
was 23.7%. Most buy upside and sell upside trades made money. Note: The
total number of buy upside and buy upside trades = ((number of upside
prices)* (number of upside prices-1))/2.Buy Upside and Sell Downside Trades
For the 24 buy upside and sell downside trades winners out numbered losers 15 (62.5%) to 9 (37.5%). The average gain was 11.2%. The maximum gain was 59.4% and the largest loss was -29%. The majority of buy upside and sell downside trades made money. The total number of buy upside and sell downside trades = (number of up prices)* (number of downside prices-1).Buy Downside and Sell Downside Trades
For the six buy downside and sell downside trades five (83.3%) lost money. The average return was a 13.3% loss. The largest gain was 4.5% and the largest loss was -22.1%. Most trades on the buy downside and sell downside were losers. Note: The total number of downside trades = ((number of downside prices)* (number of downside prices-1))/2.
CTM Analysis of a Cyclical Stock
The following example is for Kulicke & Soffa (KLIC), a cyclical semiconductor
equipment stock. The price chart shows the weekly closing prices for KLIC
from September 9, 1996 to October 5, 1998, which is one complete price
cycle.
The cycle included 109 weekly closes for 5,886 (109*108/2) buy and sell
combinations of which 2,501 (42.49%) were winners and 3,385 (57.51%) were
losers.
| CTM Summary | ||||
|---|---|---|---|---|
All Trades |
Buy Upside |
Buy Upside |
Buy Downside |
|
Number Prices |
109 | 52 | 109 | 57 |
# Trades |
5,886 | 1,326 | 2,964 | 1,596 |
# Winners |
2,501 | 1,213 | 1,068 | 220 |
# Losers |
3,385 | 113 | 1,896 | 1,376 |
% Winners |
42.49% | 91.48% | 36.03% | 13.78% |
% Losers |
57.51% | 8.52% | 63.97% | 86.22% |
Average Return |
10.73% | 73.96% | 2.06% | -25.70% |
Lowest Return |
-78.84% | -25.11% | -78.84% | -78.59% |
Highest Return |
515.09% | 515.09% | 508.11% | 67.03% |
2-Dimensional CTM Percent Returns Chart
The color-coded display of the returns for the 5,886 trades delineates
the three trade types by color. You can see that most (91.48%) of the
buy upside and sell upside trades (green) are winners and fall above the
red zero percent return line on the chart. These trades result in the
largest percent gains. Most (86.22%) of the buy downside and sell downside
trades (red) are losers and fall on or below the red line. The buy upside
and sell downside trades (blue) are distributed over much of the chart
area. But most (63.97%) of these trades are losers.
3-Dimensional CTM Percent Returns Chart
The following 3-dimensional chart displays the pattern of percent returns for the 5,886 buy and sell combinations for the KLIC price series. Each profitable trade appears in green and each unprofitable trade appears in red.The chart shows the returns of each of the 2,501 (42.49%) winning trades (green) and the 3,385 (57.51%) losing trades (red) as they are related to their buy and sell dates. Most of the winning trades in green occur for the buy upside and sell upside trades. Most of the losing trades in red are buy downside and sell downside trades and some losers are buy upside and sell downside trades.
How to Read the 3-Dimensional CTM Percent Returns Chart
The buy axis runs from the back (1996) to the front (1998) of the chart. The sell axis runs from left (1996) to right (1998). The buy axis and the sell axis form the floor of the chart. No trades can occur in the gray area because the buy date is after the sell date or the sell date is before the buy date. The pattern of positive returns looks like a mountain range whose elevations are directly proportional to the magnitude of the percent returns. The negative returns lie below the floor and appear as shallow scooped-out valleys. The back left corner of the floor is the return for the first (lowest) buy price and its first sell price. The back right corner is the return for the first buy price and the last sell price.Buy prices start at the lowest price of the series and increase to the peak along the buy price axis. After the peak price, the buy prices tend to decrease. The first (lowest) sell price is at the left side of the sell axis. Sell prices increase to the peak sell price and then decrease to the last sell price which is located at the right side of the sell axis.
The buy upside and sell upside trades are in the back left of the chart. The buy upside and sell downside trades are in the back right. The buy downside and sell downside trades are in the front right of the chart.
If you track the returns for one buy price, you will see the returns move up and down as the sell prices moves from left to right. The highest peak on the chart is the return for the first (lowest) buy price and the peak sell price. As you move from back to front on the buy axis, there are fewer trades for each buy price. And you can see the ridges of returns across sell prices for a given buy price.
The chart also shows the returns for a given sell price as you move from the first to the last buy price. For example, locate the peak return and follow the ridge of returns from the back to front of the chart. The peak return occurs for the first buy price. The lowest return, located next to the diagonal edge, occurs for the buy price just before the peak sell price. For all sell prices, the returns tend to decrease as buy prices increase on the upside.
Winners and Losers Map
Another way to view the winning and losing trades is to eliminate the relief from the 3-dimensional chart and simply plot all the trades as if you where looking straight down at the 3-dimensional chart. This perspective produces a flat 2-dimensional chart where areas of green represent winning trades and areas of red represent losing trades. In the KLIC winners and losers map 42.49% of the area is green and 57.51% is red.
3-Dimensional Chart of the Buy Upside and Sell Upside Trade Type
The 3-dimensional chart of the 1,326 buy upside and sell upside trades shows the 1,213 (91.48%) winners in green and the 113 (8.52%) losers in red. Most of the losing trades were short-term trades clustered near the diagonal axis. The highest returns occur for the earliest buy dates (lowest prices) and the dates (highest prices) near the peak of the upside. As the buy prices increase on the upside, the returns decrease.
3-Dimensional Chart of the Buy Upside and Sell Downside Trade Type
The green areas show the 1,068 (36.03%) winning trades and the large red area shows the 1,896 (63.97%) losing trades. The largest percent returns occur for the lowest buy prices early in the upside that are sold as the highest prices just after the peak. And all of the early upside buys are winners as shown by the continuous green area at the back of the chart. As the upside buy prices become higher, fewer and fewer of the downside trades make money.
3-Dimensional Chart of the Buy Downside and Sell Downside Trade Type
The large area of red shows the 1,376 (86.22%) losing trades for the buy downside and sell downside trade type. Only 220 (13.78%) trades were winners. Most of the winners appear in the large cluster of buys and sells that occurred during the price rebound in early 1998. The other green clusters represent short-term trades associated with brief price rises on the downside.
Analysis of Five Recurring Cycles
Since 1992 Kulicke and Soffa has had five price cycles, each with a distinctive upside and downside. The price chart of daily closes from July 7, 1992 to October 15, 2004 shows the completed cycles 1 through 5.
The table of percent winners shows the percent winners for each trade
type for each cycle. The buying and selling on the upside is almost always
profitable and buying and selling on the downside is mostly unprofitable.
| Percent Winners of Five KLIC Cycles | ||||
|---|---|---|---|---|
Cycle |
All Trades |
Buy Upside |
Buy Upside |
Buy Downside |
1 |
75.15% | 93.86% | 68.04% | 18.36% |
2 |
68.09% | 93.26% | 81.70% | 6.99% |
3 |
42.86% | 90.40% | 36.32% | 13.70% |
4 |
54.26% | 81.58% | 63.78% | 35.50% |
5 |
65.42% | 85.15% | 76.01% | 9.88% |
The next two tables include a tabulation of the duration and
returns for the upside and downside for each cycle. The upside and downsides
durations for cycles 2, 3 and 5 were approximately the same number of
days. Cycle 1 had a very brief downside relative to its upside. And cycle
4, the bubble cycle, had a very long downside relative to its upside.
It had the longest duration of the five downsides. All upsides had impressive
total gains and the total returns per day were similar.
| Upside Durations and Returns | |||
|---|---|---|---|
Cycle |
Duration (Days) |
Total Return |
Total Return/Day |
1 |
444 | 685.57% | 1.54% |
2 |
462 | 809.43% | 1.75% |
3 |
364 | 544.59% | 1.50% |
4 |
518 | 704.43% | 1.36% |
5 |
404 | 766.67% | 1.90% |
The downside losses were approximately the same for cycles 1, 2, 3 and
5. Cycle 4, the bubble cycle, lost 95%, the highest of the five cycles.
The loss per day was very high for the first cycle and relatively low
for the bubble cycle because its downside lasted so long.
| Downside Durations and Returns | |||
|---|---|---|---|
Cycle |
Duration (Days) |
Total Return |
Total Return/Day |
1 |
207 | -67.98% | -0.33% |
2 |
415 | -79.99% | -0.19% | 3 |
392 | -81.87% | -0.21% |
4 |
944 | -95.33% | -0.10% |
5 |
352 | -68.75% | -0.20% |
CTM Percent Return Charts of Five Cycles
The CTM percent returns chart for the five cycles shows the winning buy
and sell combinations in green and the losers in red. The chart shows
the peaks and valleys of the percent returns for every buy and sell combination
for the five cycles. Of the 11,325 monthly buy and sell combinations 7,360
(64.99%) were winners and 3,965 (35.01%) were losers.
I used the monthly closes because they produce the best looking 3-dimensional
chart for a long price series. The resolution is very poor for 3-dimensional
charts that include too many data points. Also the percent winners and
percent losers have slightly different values for monthly, weekly and
daily closes. But the differences are not large enough to be significant.
CTM Winners and Losers Map of Five Cycles
The winners and losers map shows the pattern of the winning and losing buy and sell combinations. The vertical areas of red represent the losing trades that resulted from selling at and around lows of the cycles. For example, the two large vertical red areas at the right side of the map represent the losing trades resulting from selling at or around the lows at the end of the fourth and fifth cycles.The horizontal patterns of red represent losing trades resulting from buying at high prices and selling at many different sell prices.
Summary and Conclusions
The Complete Trading Model (CTM) analysis shows that buying and selling on the upside gives investors a very high probability of making money. Even buying on the upside and selling on the downside can be very profitable. But buying and selling on the downside almost always guarantees that you will have difficulty making money. The problem with buying on the downside is that no matter what price you pay, prices are likely to fall some time after you buy.
If you buy near the bottom of the downside, you could make
money on the upside of the next cycle. But if you buy at relatively
high prices on the downside, you might never make money or have to wait
a long time to make money on the next cycle. Investors who bought just
after the peak of the 2000 bubble in technology prices will wait for
years or perhaps decades just to break even much less make a profit.
Related Articles and Calculators
Stock 3d Percent Returns Chart Articles
3D Surface Chart of Returns: Upside Price Pattern for Amazon
3D Surface Chart of Returns: Upside Downside Price Pattern for Chipotle Mexican Grill
Cyclical Price Pattern - An Opportunity to Make Money
Cyclical Price Return Calculator
Stock Price Upside Returns Calculator: Upside Produces Large and Small Gains
Stock Return Calculator for Profitable and Unprofitable Buy Prices
Stock Return Map Maker - See Patterns of Winners and Losers