
The AI (ChatGPT) Stock Investing Handbook: Double Bottom
Here is the response from ChatGPT for the prompt double bottom 250 words entered on January 25, 2023.
A double bottom is a bullish reversal pattern that is formed when an asset's price reaches a trough, bounces back up to a moderate peak, and then falls back down to the same trough again. This pattern is considered to be a bullish reversal signal, as it suggests that the asset's price may be about to rise.
The double bottom pattern is considered to be one of the most reliable reversal patterns in technical analysis. Traders often look for confirmation of a double bottom pattern by watching for a breakout above the peak that separates the two troughs, as well as an increase in volume during the formation of the pattern. The breakout is considered to be a key signal that the trend has reversed and that the price is likely to continue to rise.
One of the key characteristics of the double bottom pattern is that the two troughs should be roughly equal in price. This is important because it suggests that buyers are stepping in to support the price at the same level, which is a strong bullish signal. Additionally, the peak between the two troughs should not be too high, as this can indicate that the trend is not reversing and that the price is likely to continue to fall.
Another important aspect to consider when analyzing a double bottom pattern is the volume. As the pattern develops, traders often look for an increase in volume as a confirmation of the reversal. This is because a significant increase in volume suggests that there is increased buying activity, which supports the idea that the trend is reversing.
In general, the double bottom pattern can be a useful tool for traders looking to identify potential reversal points in the market. However, it is important to keep in mind that this pattern is not foolproof, and traders should always combine it with other forms of analysis, such as fundamental analysis and market sentiment, to make more informed trading decisions.
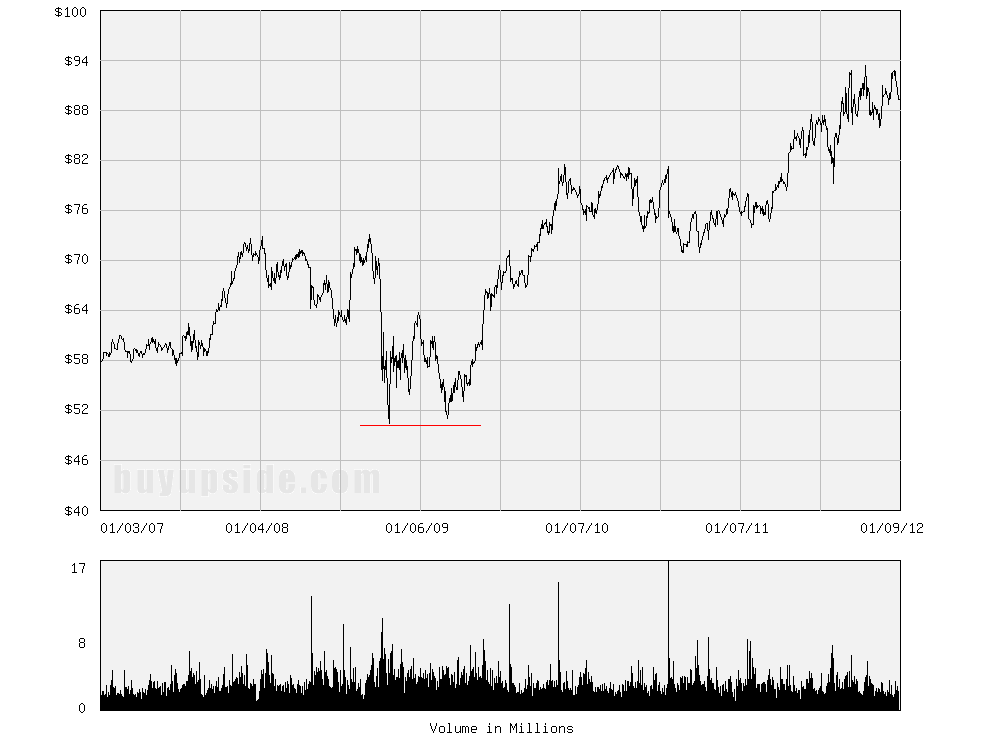
Double Bottom Chart - Not from ChatGPT
Avoid Selling Stocks at Bottoms Head and Shoulders Bottom
Previous Article
Table of Contents
Next Article
Own Stocks Get Started Dividends Retirement Buy Sell Hold Stock Portfolios ETFs Mutual Funds Cautions Indexes Price Patterns Options Econ
S&P 500 Investing Guide ESG Investing Guide Dividend Handbook Bond Investing Handbook Crypto as a Scam (CryaaS) Crypto Horror Stories Stock Investing Stories #1-#54
buyupside.com